¶ Quick start guide
Welcome to ariadne.ai SPATIAL. This guide walks you through the first steps to get your data loaded and your first analysis running. For a full end-to-end analysis walkthrough, see the Guides section.
¶ Setup
- Open https://spatial.ariadne.ai
- Log in or sign up depending on whether you have an account.
- The dataset management window will appear.
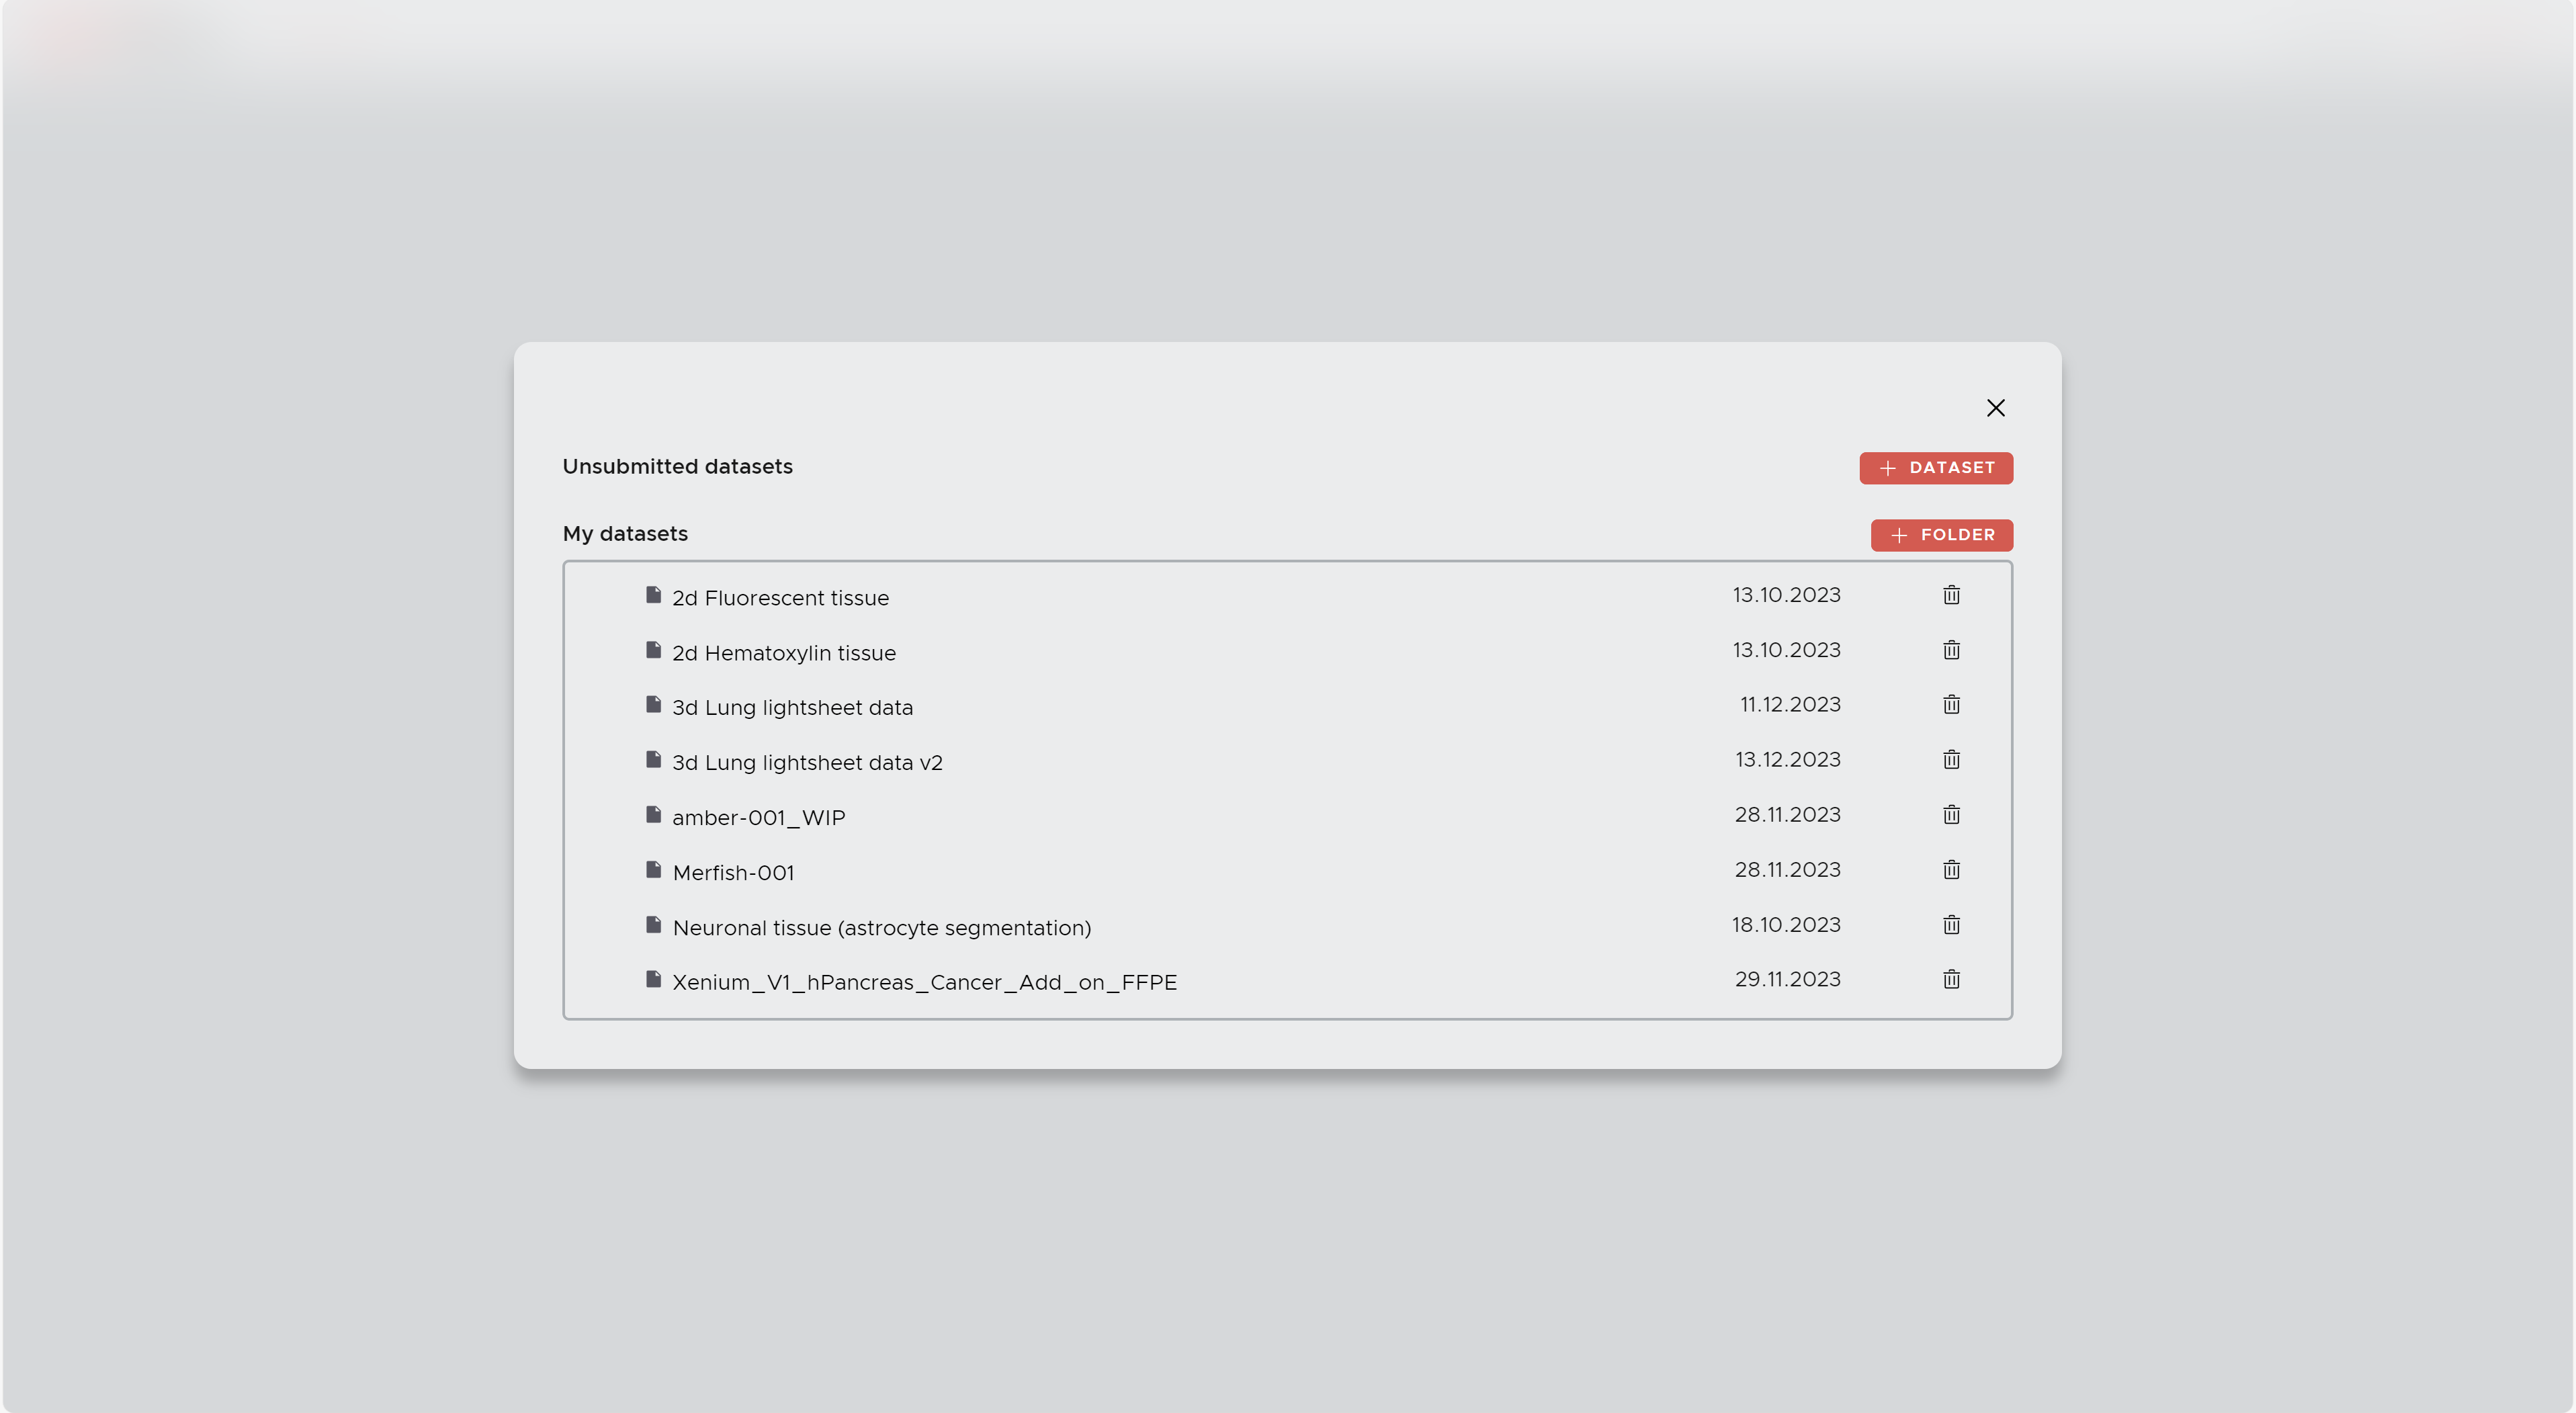
- Click on one of your existing datasets to start working with it, or click + DATASET to upload a new dataset. The upload window will appear where you can select and submit your files.

¶ Step 2 — Get to know the main window
SPATIAL is organized around three panels surrounding your image data.
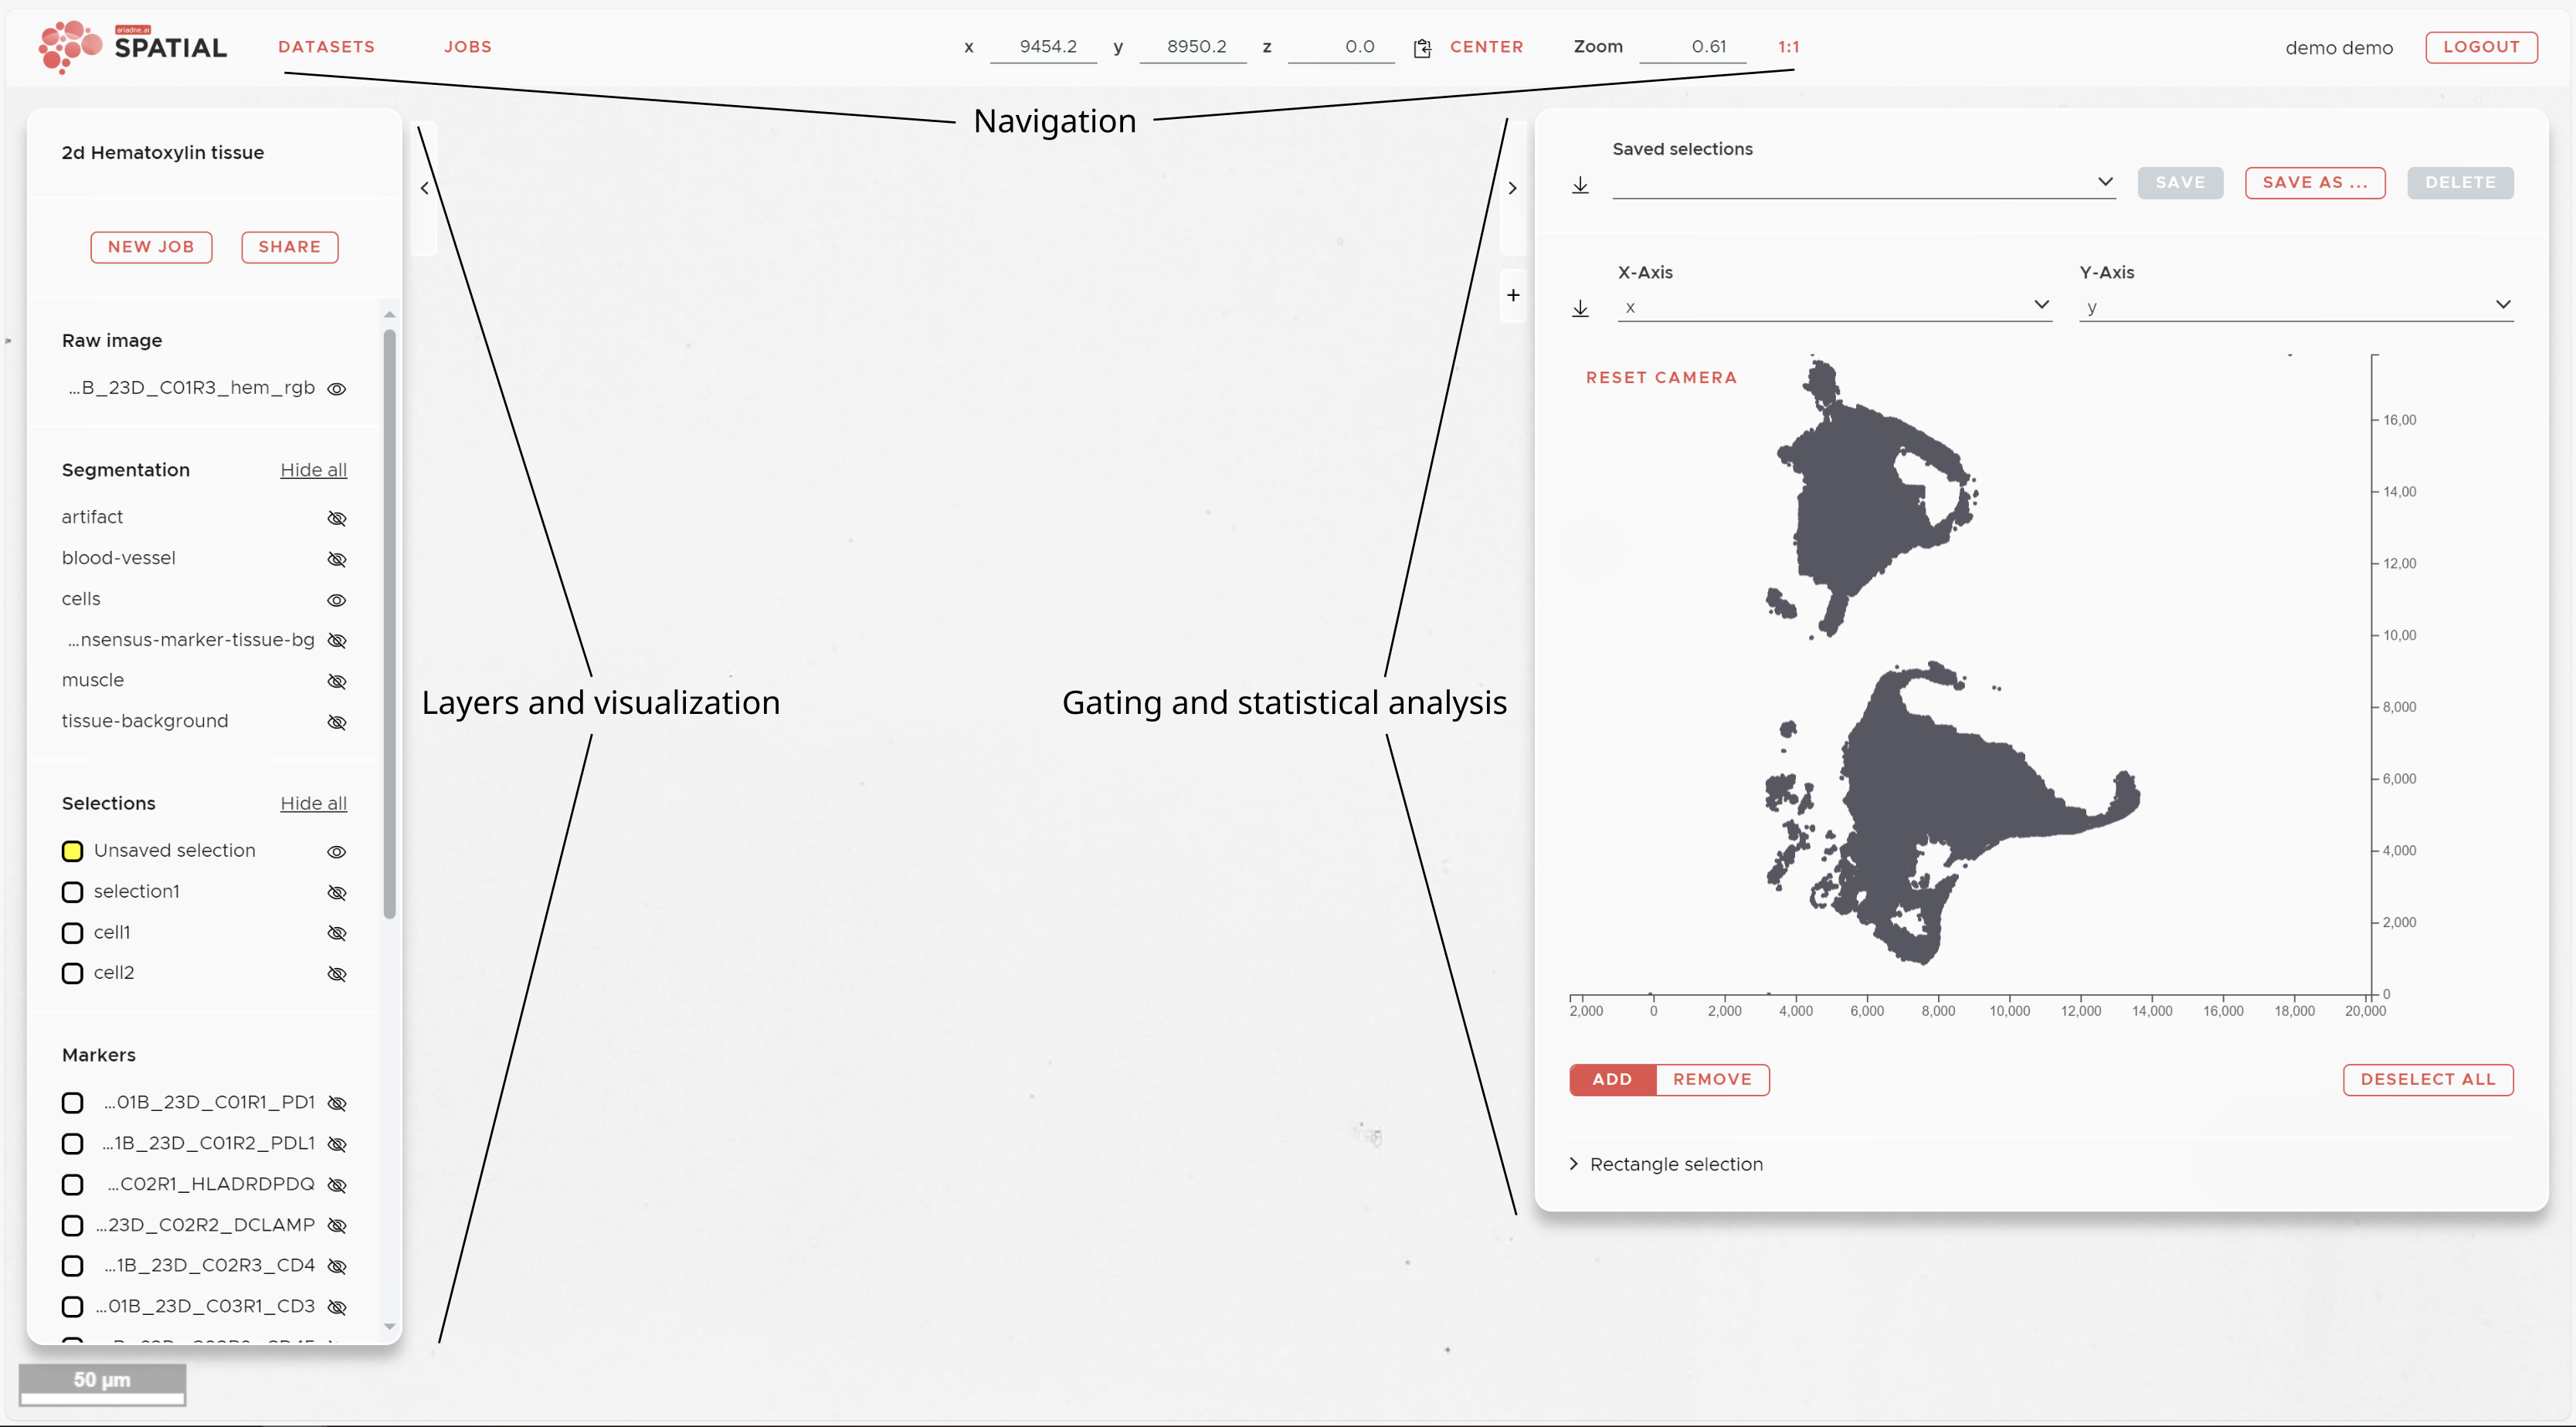
Left panel — Visualization: All layers for your dataset, organized by category (image channels, segmentations, selections, markers). Click the eye icon to show or hide a layer. Click the layer name to adjust color, opacity, brightness, and contrast. Click the + icon to add a missing layer
Right panel — Statistics: Access per-cell marker intensities, manual gating, dimensionality reduction results (t-SNE, UMAP), and spatial analysis outputs (RCN, Neighborhood Enrichment). Click + to add a new view.
Top panel — Navigation: Current coordinates and zoom level. Use CENTER to fit the dataset in view, 1:1 to reset zoom, and JOBS to monitor running and completed jobs.
¶ Step 3 — What to do after upload
Once your dataset has been converted and is ready (you will receive a notification), this is the order of steps to follow:
1. Registration (multi-omics or non registered cyclic experiments only)
If your data spans multiple staining cycles, run Registration first to align all channels to a common reference. Skip this step if all your markers were acquired in a single session.
2. Segmentation (required)
Segment your cells, tissue regions, or pathological structures. Start with Auto Segmentation — select a pretrained model from the library that matches your tissue and staining, assign your image layers to its inputs, and submit. You will get a segmentation result immediately without any manual configuration.
If no model in the library fits your data, use Custom Segmentation or contact ariadne.ai to have a model trained for your specific use case.
3. Intensity Map (required)
Once segmentation is complete, run an Intensity Map job. This measures the expression of every marker channel within each segmented cell and creates a per-cell data table (Mapping) that all downstream analysis depends on.
4. Explore & identify cell populations
With the Mapping ready, use the right panel to explore marker distributions. Run t-SNE or UMAP to cluster cells by marker expression and gate populations visually, or run Automatic Cell Type Detection to assign cell type labels automatically.
5. Spatial analysis
With cell populations defined as Selections, run Neighborhood Enrichment to quantify pairwise co-localization, or Recurrent Cellular Neighborhoods to identify recurring spatial microenvironments in your tissue.
¶ Submitting your first jobs
Click the NEW JOB button (top left) to open the job submission panel. A full description of every job type and its parameters is on the Submitting Jobs page.
For a detailed description of each job and its parameters, see Submitting Jobs.
¶ Next steps
- New to spatial analysis? Read the Analysis Workflows guide for a complete step-by-step walkthrough.
- Want to understand the methods? See the Statistical analysis page for in-depth descriptions of RCN and Neighborhood Enrichment.
- Questions? Get in touch with the ariadne.ai team — we are happy to help.